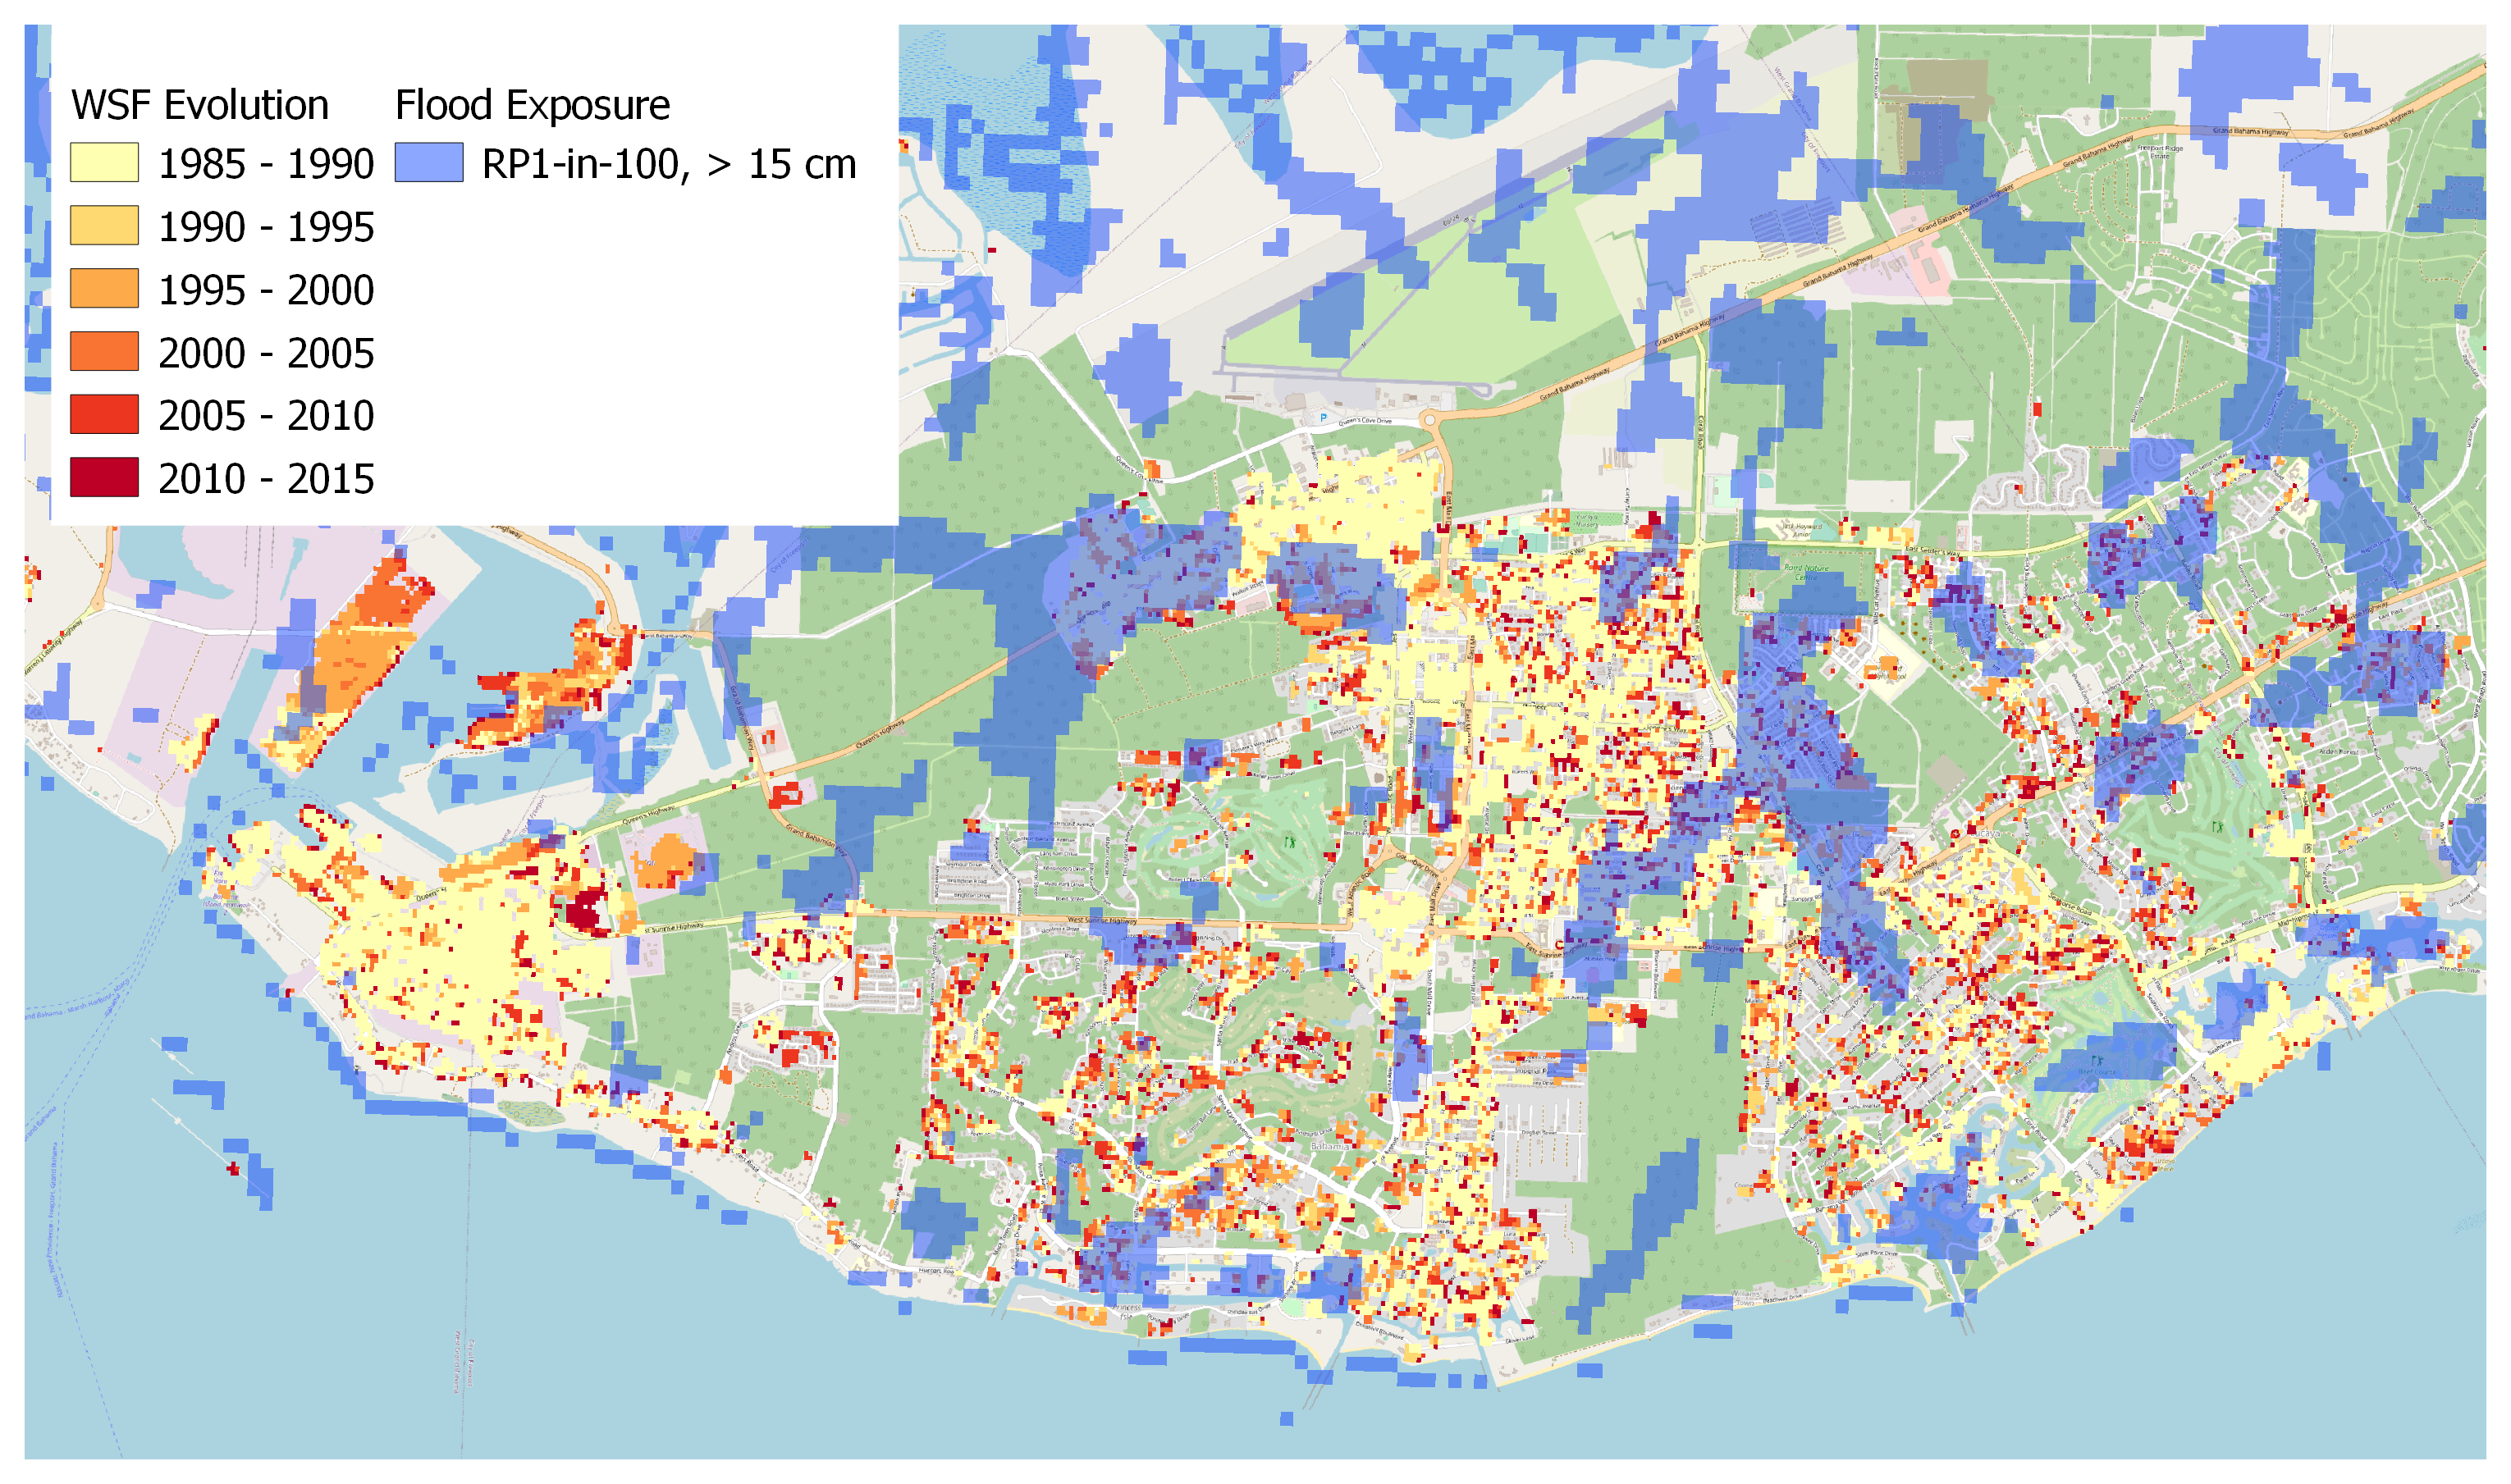


The first part of the script assembles raster files from various sources (flood data, built-up evolution, and population) to create one single virtual raster stack for each country.
One of the biggest challenges was setting up a workflow to clean and process monstrously disorganized flood data. The data is complex for two reasons: (1) flood depth is estimated for different sources of flooding (fluvial, pluvial, or coastal), and different scenarios of flood intensity (return period), and (2) the technical properties of the data were inconsistent across islands. The key workaround here was to build GDAL commands to merge flood tiles and project them into one raster file, then subsequently stack them along with other exposure data via more GDAL magic (BuildVRT).
I was blown away by how well this last command worked. It just worked! And the spatial resolution of the data? Originally, I wanted to preserve the highest resolution available from all the datasets (30-meter), but in the end I settled on the resolution of the population dataset (~100-meter) to avoid up-sampling population.
The virtual raster by itself does not preserve information about the order in which the raster bands have been stacked. Some countries had incomplete datasets, so the order wasn’t consistent across all VRTs. To account for this, I implemented a simple dictionary to keep track of each band index and what dataset it contained.
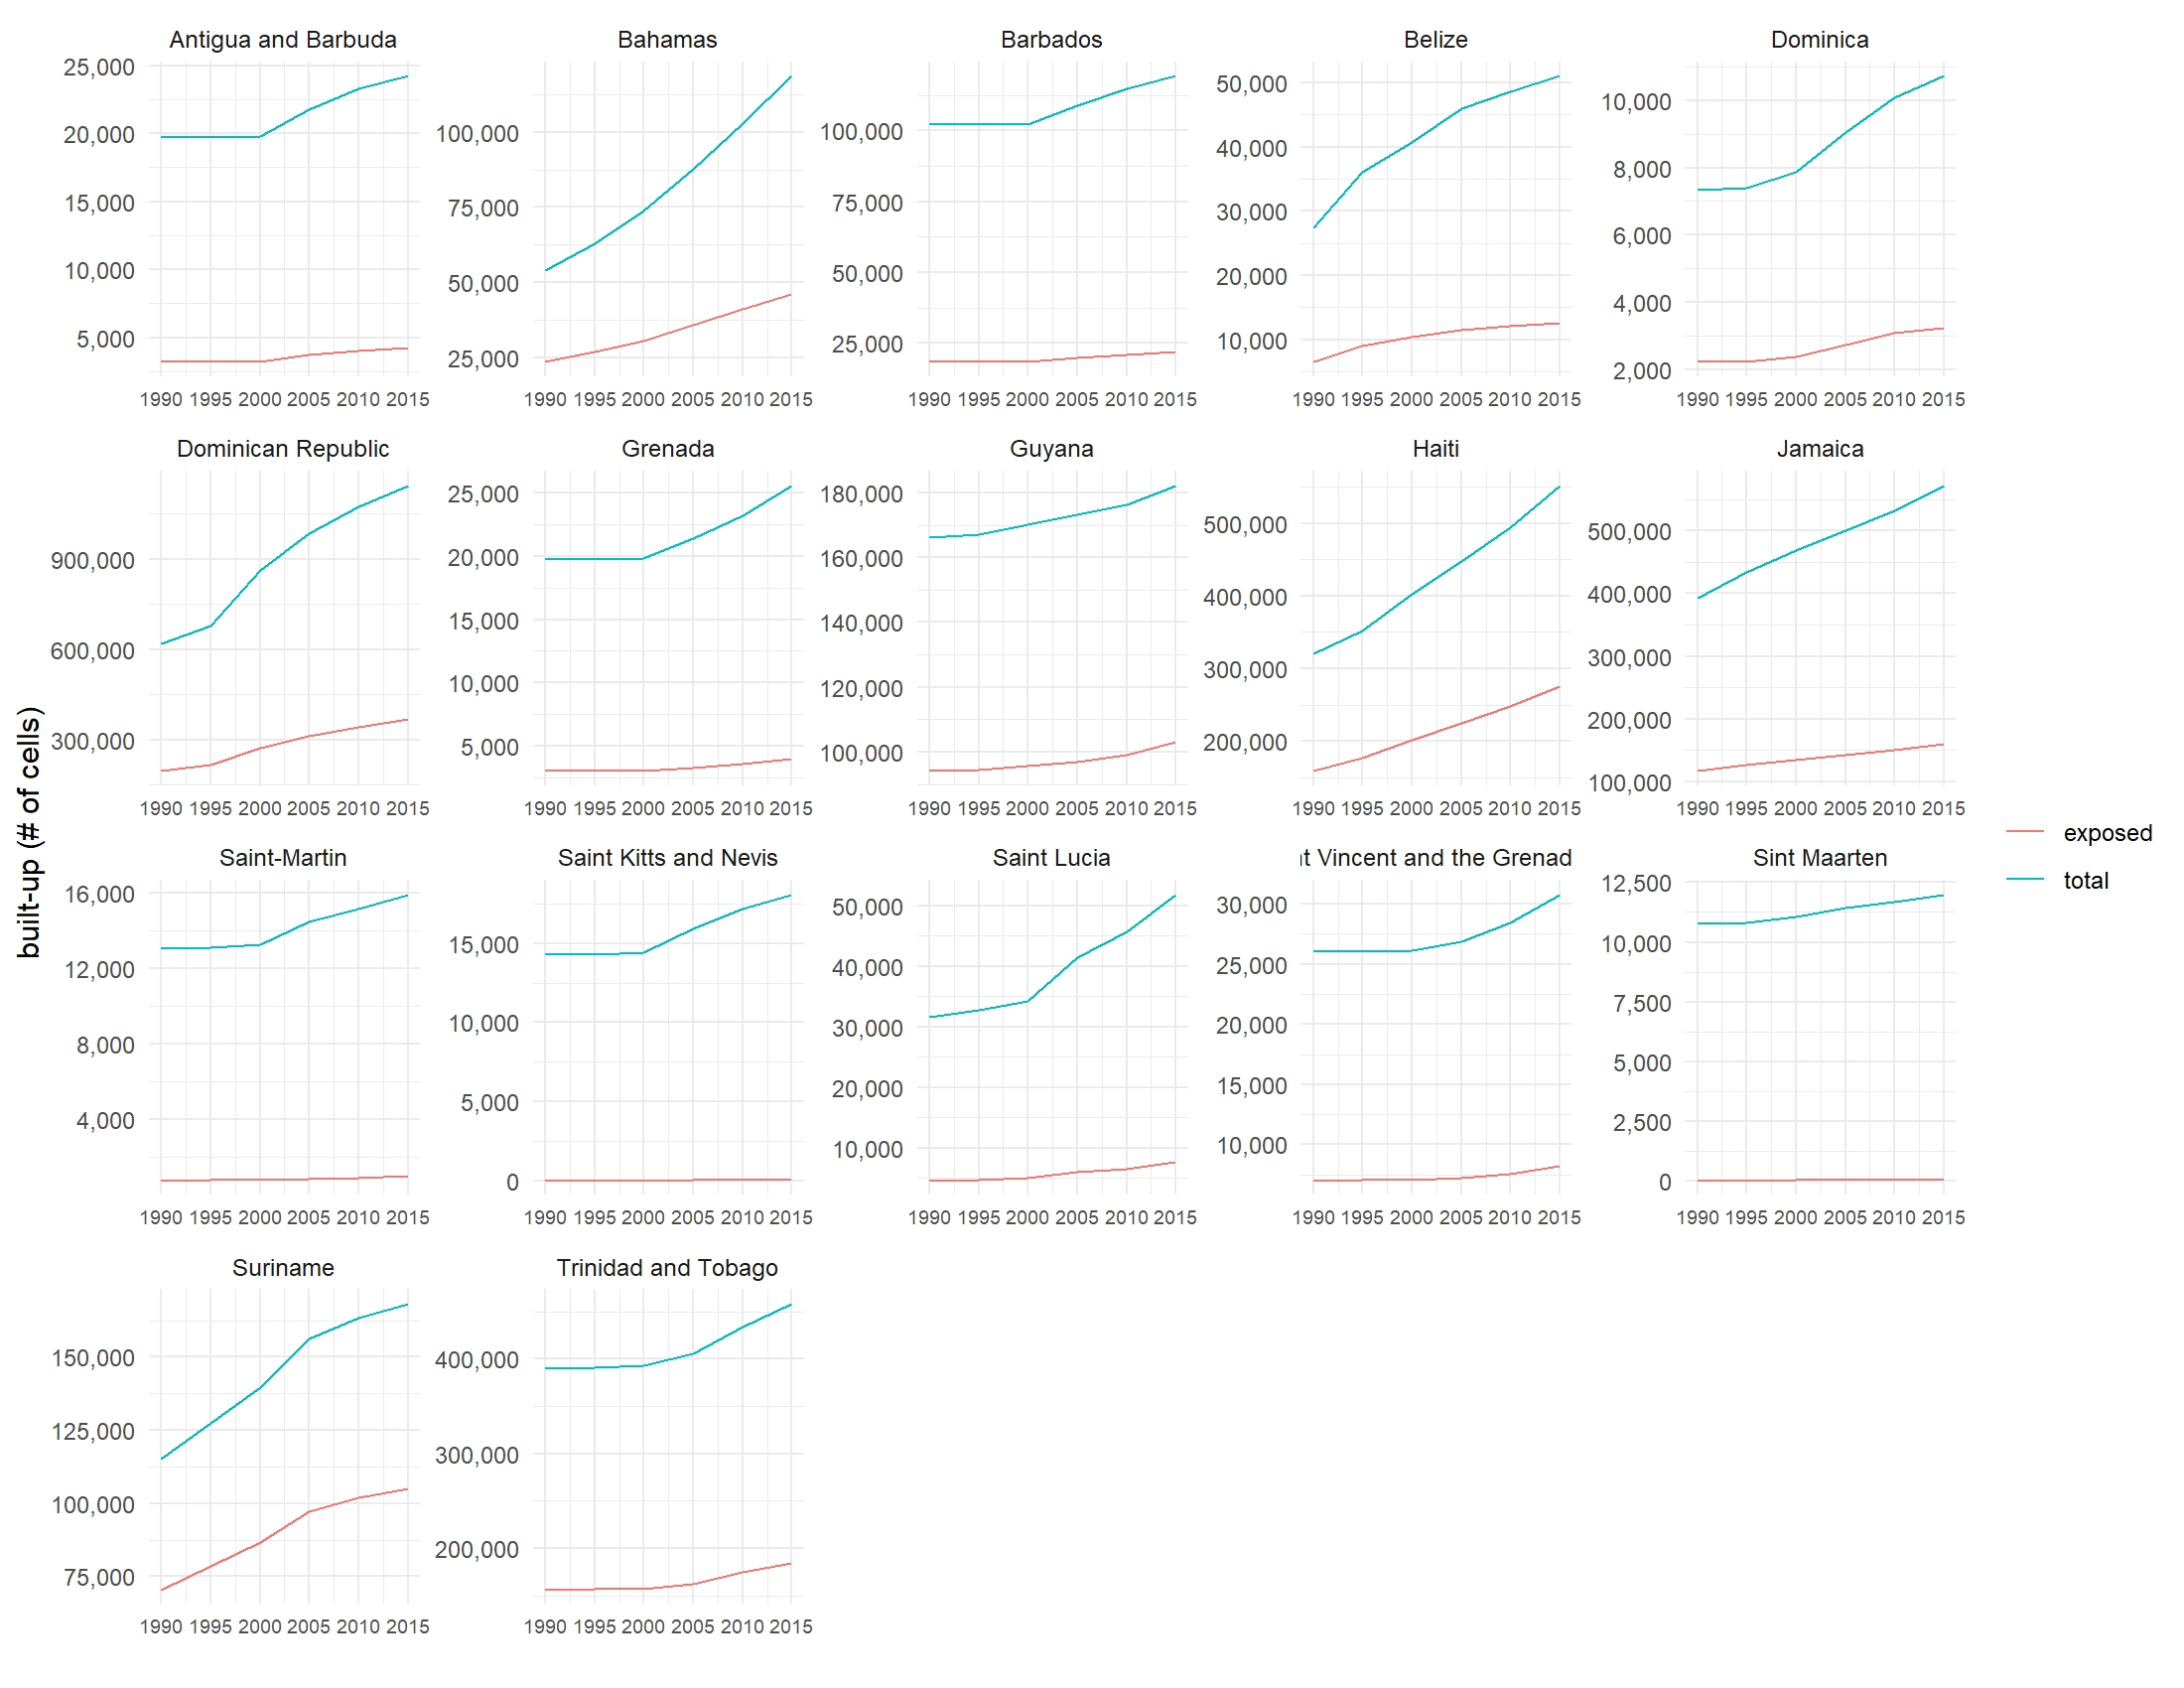
The second part of this script loops through the different flood scenarios and intersects exposure data to calculate zonal statistics. The results store the number of urban cells exposed to floods and the number of people exposed to floods, at different points in time.
The first version of this script quickly crashed when it tried to load a multi-band raster for the Bahamas. It was just too much data to load at once. This prompted me to tweak the implementation and use urban extents as the unit of analysis, using rasterio’s window reading to avoid issues with memory. Results would then be aggregated to the country-level at a later step, making use of a pandas MultiIndex to keep track of the flood scenario characteristics.